Smash Factor Explained: What It Is and How to Improve Yours
Smash factor is ball speed divided by club head speed. The average 14.5 handicap sits at 1.44. Moving to 1.48 at 100 mph adds 12 yards (11m) of carry.
Smash factor is exit velocity divided by club head speed. The number tells you how much of your swing made it onto the ball at impact, with tempo stripped out.
A 1.44 reading after a tee shot puts you on the average Trackman Combine figure for a 14.5 handicap. Tour pros sit at 1.49. That gap, at 100 mph club speed, equals about 12 yards (11m) of carry. No fitness work, speed training, or new shaft required. Centred contact does the heavy lifting, and almost nobody needs a harder swipe to find it. Most weekenders leave free yards on every drive, and the lever is simple: hit the middle of the face more often.
TL;DR
- 1SF is ball speed divided by club speed. Average 14.5 handicap sits at 1.44 (Trackman). Tour pros sit at 1.49.
- 2Moving from 1.44 to 1.48 at 100 mph adds about 12 yards (11m) of carry. Same swing, just better contact.
- 3Centredness of contact is the primary lever. Toe and heel misses cost 3 to 8 mph of ball speed (Foresight Sports).
- 4The ceiling is near 1.50, not exactly 1.50. The USGA caps face COR at 0.830, which sets the physical ceiling at 1.48 to 1.50 for a conforming driver.
- 5Track averages, not single shots. Use impact tape, fix attack angle for the driver, and watch a rolling 10-shot mean.
What Smash Factor Actually Measures
One line of math. Take ball velocity off the cover, divide by clubhead pace at impact. A driver swung 100 mph sending a shot out at 150 reads 1.50. Same motion, only 140 leaves the dimple, that reads 1.40. The 10 mph gap leaked between hitting surface and ball, and per Trackman's research, those 10 mph translate to about 20 yards (18m) of total distance.
Why a ratio beats raw numbers: it strips tempo out of the read. Two players might both register 150 off the cover, one swinging 100 at 1.50, the other 105 at 1.43. Distance, identical. Problem, not. Player two bleeds 7 mph every swipe, a leak that surfaces the moment their head-pace plateau hits.
Irons read lower than driver, which is not a sign of poor strikes. Static loft funnels much of the collision energy into backspin: a pitching wedge at 46 degrees sits around 1.25 centre-face, and PGA averages show a 6-iron at 1.39. Spin loft sets the ceiling here. The wider the gap between how the head delivers at impact and how it travels in, the more energy spills into rotation instead of forward motion.
Definitions worth nailing down. Smash factor: ball velocity over swing pace at strike. Spin loft: dynamic delivery minus angle of approach. The first is an outcome, the second one of the inputs that produces it.
What's a Good Smash Factor?
For the big stick, the target depends on handicap, but the difference from weekend average to elite play is smaller than most golfers assume.
| Skill Level | Driver Smash Factor |
|---|---|
| PGA Tour | 1.49 |
| LPGA Tour | 1.49 |
| Scratch amateur | 1.49 |
| 5 handicap | 1.45 |
| 10 handicap | 1.45 |
| 14.5 handicap (average) | 1.44 |
| Bogey golfer | 1.43 |
Source: Trackman Combine data, updated February 2026.
A couple of patterns stand out. Scratch and 5 handicap players land within 0.04 of professionals, so the room to move sits with the 10-plus group. From 14.5 down to bogey, the window is 0.01, which is almost noise. Most weekenders, regardless of scorecard, work inside the same narrow band of striking quality off the tee.
Iron numbers run lower by design. PGA averages put a 6-iron at 1.39 and the LPGA at 1.41.
A related metric arrived in November 2025 worth knowing about. Smash Index is your reading divided by the expected maximum SF for that specific club. A score of 100% means top efficiency for that club-shaft combination. The index normalises across the bag: 1.30 on a wedge can match 1.50 with a big stick, because both represent ceiling performance. If you own a Trackman or compatible unit, this view shows centred contact more clearly, beating raw SF as a progress signal.
Why Smash Factor Has a Ceiling Near 1.50
The YouTube-comments answer is wrong. The USGA does not set a smash factor limit. No rule book number says 1.50 is the maximum.
What the USGA does cap is face COR, set at 0.830 since 1998 (R&A joined in 2002, and CT testing replaced direct measurement in 2004). The USGA's collision research walks through the physics: face stiffness, head mass around 200 grams, and typical driver loft together limit the maximum exit-velocity-to-head-velocity ratio at 1.48 to 1.50 for a conforming driver hit centre-face. The 1.50 ceiling is a consequence of the rule, not the rule itself.
So why do Tour leaderboards sometimes show 1.51 or 1.515? Tom Wishon, the PGA club designer interviewed by MyGolfSpy in June 2025, attributes those readings to launch monitor tolerance. Most pro units measure both inputs within ±1 mph. Stack the tolerance the right way on both and a swing that produced 1.49 gets recorded as 1.51. Sensor variance, not rule-breaking.
Range balls compress the same physics in a different way. Trackman's research shows they produce 0.05 to 0.07 lower SF than premium balls at the same swing pace, because harder covers and lower-COR materials lose more energy to deformation at strike. The 1.41 you saw with bucket balls is closer to 1.46 on the course with a Pro V1. Track improvement with the same ball type, on a home monitor where possible.
If your portable monitor shows 1.52 or higher across many sessions, that is sensor variance, not a magic driver. Reset to the 10-shot rolling average.
What Drives Smash Factor
Four factors set the number. Ranked by how much each one moves the needle, per Foresight Sports' impact research from March 2024.
- Centredness of contact. The biggest lever by a long way. Toe and heel misses on the driver cost 3 to 8 mph of exit velocity even when head pace stays identical, because the gear effect twists the face and bleeds energy into off-axis spin.
- Spin loft. The gap between dynamic loft at impact and attack angle. Wider gap, more spin, lower smash.
- Attack angle. A steep negative driver AoA inflates spin loft, which kills smash, even on centre-face strikes. I covered the AoA numbers over here, including why most weekenders hit down at -1.8 degrees when they should be climbing through impact.
- Equipment fit. The wrong shaft flex changes how the head presents at impact, which changes dynamic loft delivery, which changes spin loft. A background input, not the primary lever, but it shows up when nothing else explains a stuck reading.
Andrew Rice, an instructor at Berkeley Hall Golf Club and a Trackman Combine teacher, draws the distinction: "Smash Factor is often misunderstood as being representative of only how centered a ball was struck. I stress that it purely represents how well a player converted club speed into ball speed."
Centredness is the biggest input, but not the only one. James Leitz at Pinewood Country Club, also a Trackman teacher, lists the diagnostic order: "Face to path relationships, spin loft, and impact point location are the main factors to look at after you have determined that the Smash Factor is too low."
If your driver SF sits at 1.40 or below, the first suspect is impact location, the second is spin loft, and the third is shaft fit. Work the list in that order. My shaft flex guide covers the third one in detail.
How to Improve Your Smash Factor
Three steps, ordered by impact and time-to-result.
Step 1: Map your strike with impact tape
About $10 on Amazon, and the most useful $10 you will spend on your swing this year. Stick a sheet to the face, hit 10 shots, pull the tape. The pattern tells you where your contact lives.
- Toe pattern. Cause: standing too close, body backs out of the swing to make room. Fix: set up half a clubhead-width further from the ball.
- Heel pattern. Cause: standing too far away, or a path that runs over the top. Fix: address closer and check the trail elbow stays connected on the way down.
- Low-face pattern (driver). Cause: tee too low, or attack angle too steep. Fix: tee higher, half above the crown at address.
Know which one is yours, then drill the matching setup change for two range sessions before re-testing.
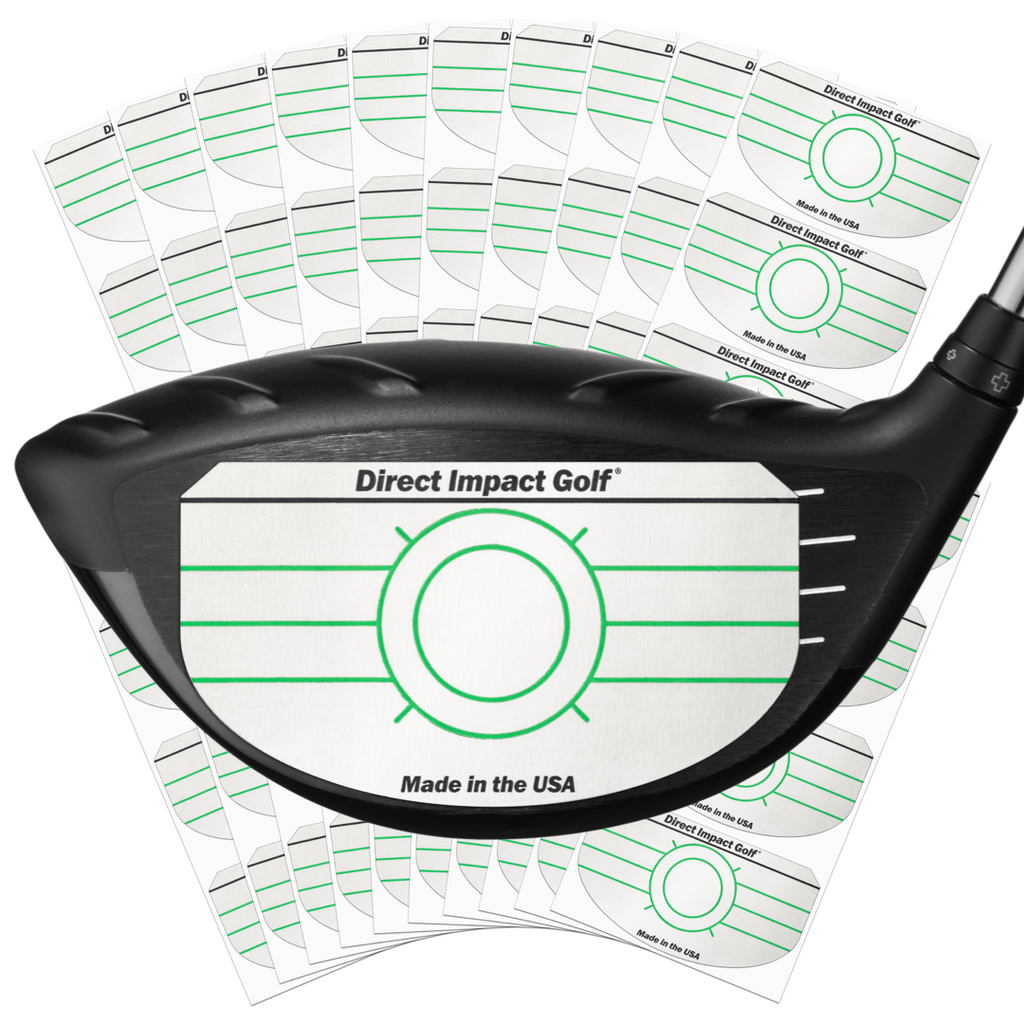
Asyxstar Golf Impact Tape (150 pcs)
Step 2: Fix attack angle for the driver
For amateurs swinging under 100 mph off the tee, AoA is the second-biggest lever after centredness. Moving from a typical -1.8 to +3 degrees can shift smash factor by 0.03 to 0.05 on its own, by tightening spin loft. (Not sure where your speed sits? My swing speed chart covers the brackets.)
Three setup changes do the work:
- Ball position forward, off the inside of the lead heel.
- Tee height with half the ball above the crown at address.
- A small lead-hip bump toward the target, which tilts the spine away and produces an upward path through impact.
These are setup changes, not swing changes. Fifteen minutes on a range with a monitor reporting AoA tells you whether they worked. The full breakdown, including why pros can hit down on the driver and amateurs cannot, lives in my deeper dive on attack angle.
Step 3: Track averages, not individual shots
Single-shot SF readings vary within sensor tolerance. A 1.42 followed by a 1.49 on the same motion is not improvement, it is noise. The metric is the rolling 10-shot mean over many sessions. A move from a session average of 1.44 to 1.47 over four range visits, with the same ball and the same monitor, is real progress.
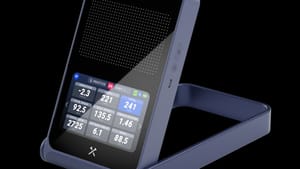
For an entry-level unit that reports SF on every shot without a subscription or PC requirement, the PRGR HS-130A is the cleanest option under $300. Doppler radar, no spin or launch data, but it nails head and exit velocities, smash factor, and carry on every shot.

PRGR HS-130A Portable Golf Launch Monitor
How Much Distance Are You Leaving on the Table?
The carry payoff for moving SF without changing head pace is bigger than most weekenders assume. Numbers below pull from Trackman, formula via UpYourClub's March 2026 breakdown.
| Club Speed | SF Improvement | Ball Speed Gain | Carry Gain |
|---|---|---|---|
| 90 mph | 1.44 to 1.48 | +4 mph | +8 yards (7m) |
| 100 mph | 1.44 to 1.48 | +4 mph | +12 yards (11m) |
| 110 mph | 1.44 to 1.48 | +5 mph | +15 yards (14m) |
These are carry gains at the same head pace. No fitness work, no speed training, no new driver. Average contact moves to good contact, and the math does the rest. For a 100 mph swinger, 12 yards (11m) of free carry is the gap between a 7-iron and an 8-iron into a 175-yard (160m) par 3.
The move from 1.44 to 1.48 is closeable for almost every amateur, and it is worth more yardage per session than any swing fix that does not also involve speed training. Free yards are rare in this game. This is one of the rare places they live.
Frequently Asked Questions
Does the USGA limit smash factor to 1.5?
No. The USGA caps driver face COR at 0.830, set in 1998 (R&A joined in 2002, CT testing replaced direct measurement in 2004). That rule, combined with typical driver loft and a head mass around 200 grams, limits the practical maximum SF to 1.48 to 1.50 for a conforming driver struck centre-face. The 1.50 ceiling is a physics consequence of the COR rule, not a smash factor rule. Tour readings above 1.50 are sensor tolerance, since most units measure both inputs within ±1 mph.
Why is my smash factor lower at the driving range?
Range balls. Trackman research shows they produce 0.05 to 0.07 lower SF than premium balls at the same swing speed, because harder covers and lower-COR materials lose more energy to deformation at strike. A 1.41 on the range with striped balls is closer to 1.46 on the course with a Pro V1. Track improvement with the same ball type.
Should I care about smash factor for my irons?
Yes, but expect lower numbers than the driver and watch the trend rather than the absolute value. Trackman's PGA Tour averages put a 6-iron at 1.39 and the LPGA at 1.41. A pitching wedge sits in the 1.25 to 1.30 range on clean contact because more static loft sends a bigger share of the collision into backspin. Trackman's Smash Index metric (November 2025) is more useful for irons than raw SF, because it normalises against the expected ceiling for that specific club's loft.
Can I improve smash factor without a launch monitor?
You can make a start. Impact tape on the face, around $10 on Amazon, will show you where your contact lives. A toe pattern means you are standing too close. A heel pattern means too far away. A low-face pattern on the driver means your tee is too low or your attack angle too steep. You cannot measure SF without a monitor, but fixing impact location is the primary lever, so tape gets you most of the way. For a hard number, the PRGR HS-130A reports SF on every shot for under $300.
What is the difference between smash factor and ball speed?
Ball speed is how fast the shot leaves the face, in mph. Smash factor is exit velocity divided by head velocity, as a ratio. SF strips out the swing-pace variable. Two players might both register 150 off the cover, one swinging 100 at 1.50, the other 105 at 1.43. Distance is the same, but the second is bleeding 7 mph of free pace off the face every shot. SF tells you about contact quality. Ball speed tells you about distance potential. You want both, and you fix them apart.
Find your number first. Stick impact tape on the face on your next range visit, hit 10 shots, and read the pattern. If you have a monitor, log a 10-shot rolling SF average against the same ball type. From there, the priority order is centredness, then attack angle, then shaft fit. Most weekenders find their first 5 to 10 yards (4 to 9m) of free carry inside two sessions if they work the list in that order. Buying a new driver before you know your SF average is the wrong order of operations.
Some links in this article are affiliate links. If you buy through them, I earn a small commission at no extra cost to you. This never influences what I recommend. I link to gear I'd buy myself.


Subscribe to our newsletter to get the latest golf insights first
Products mentioned in this guide